2012, 2016 Comparison
Map Comparisons
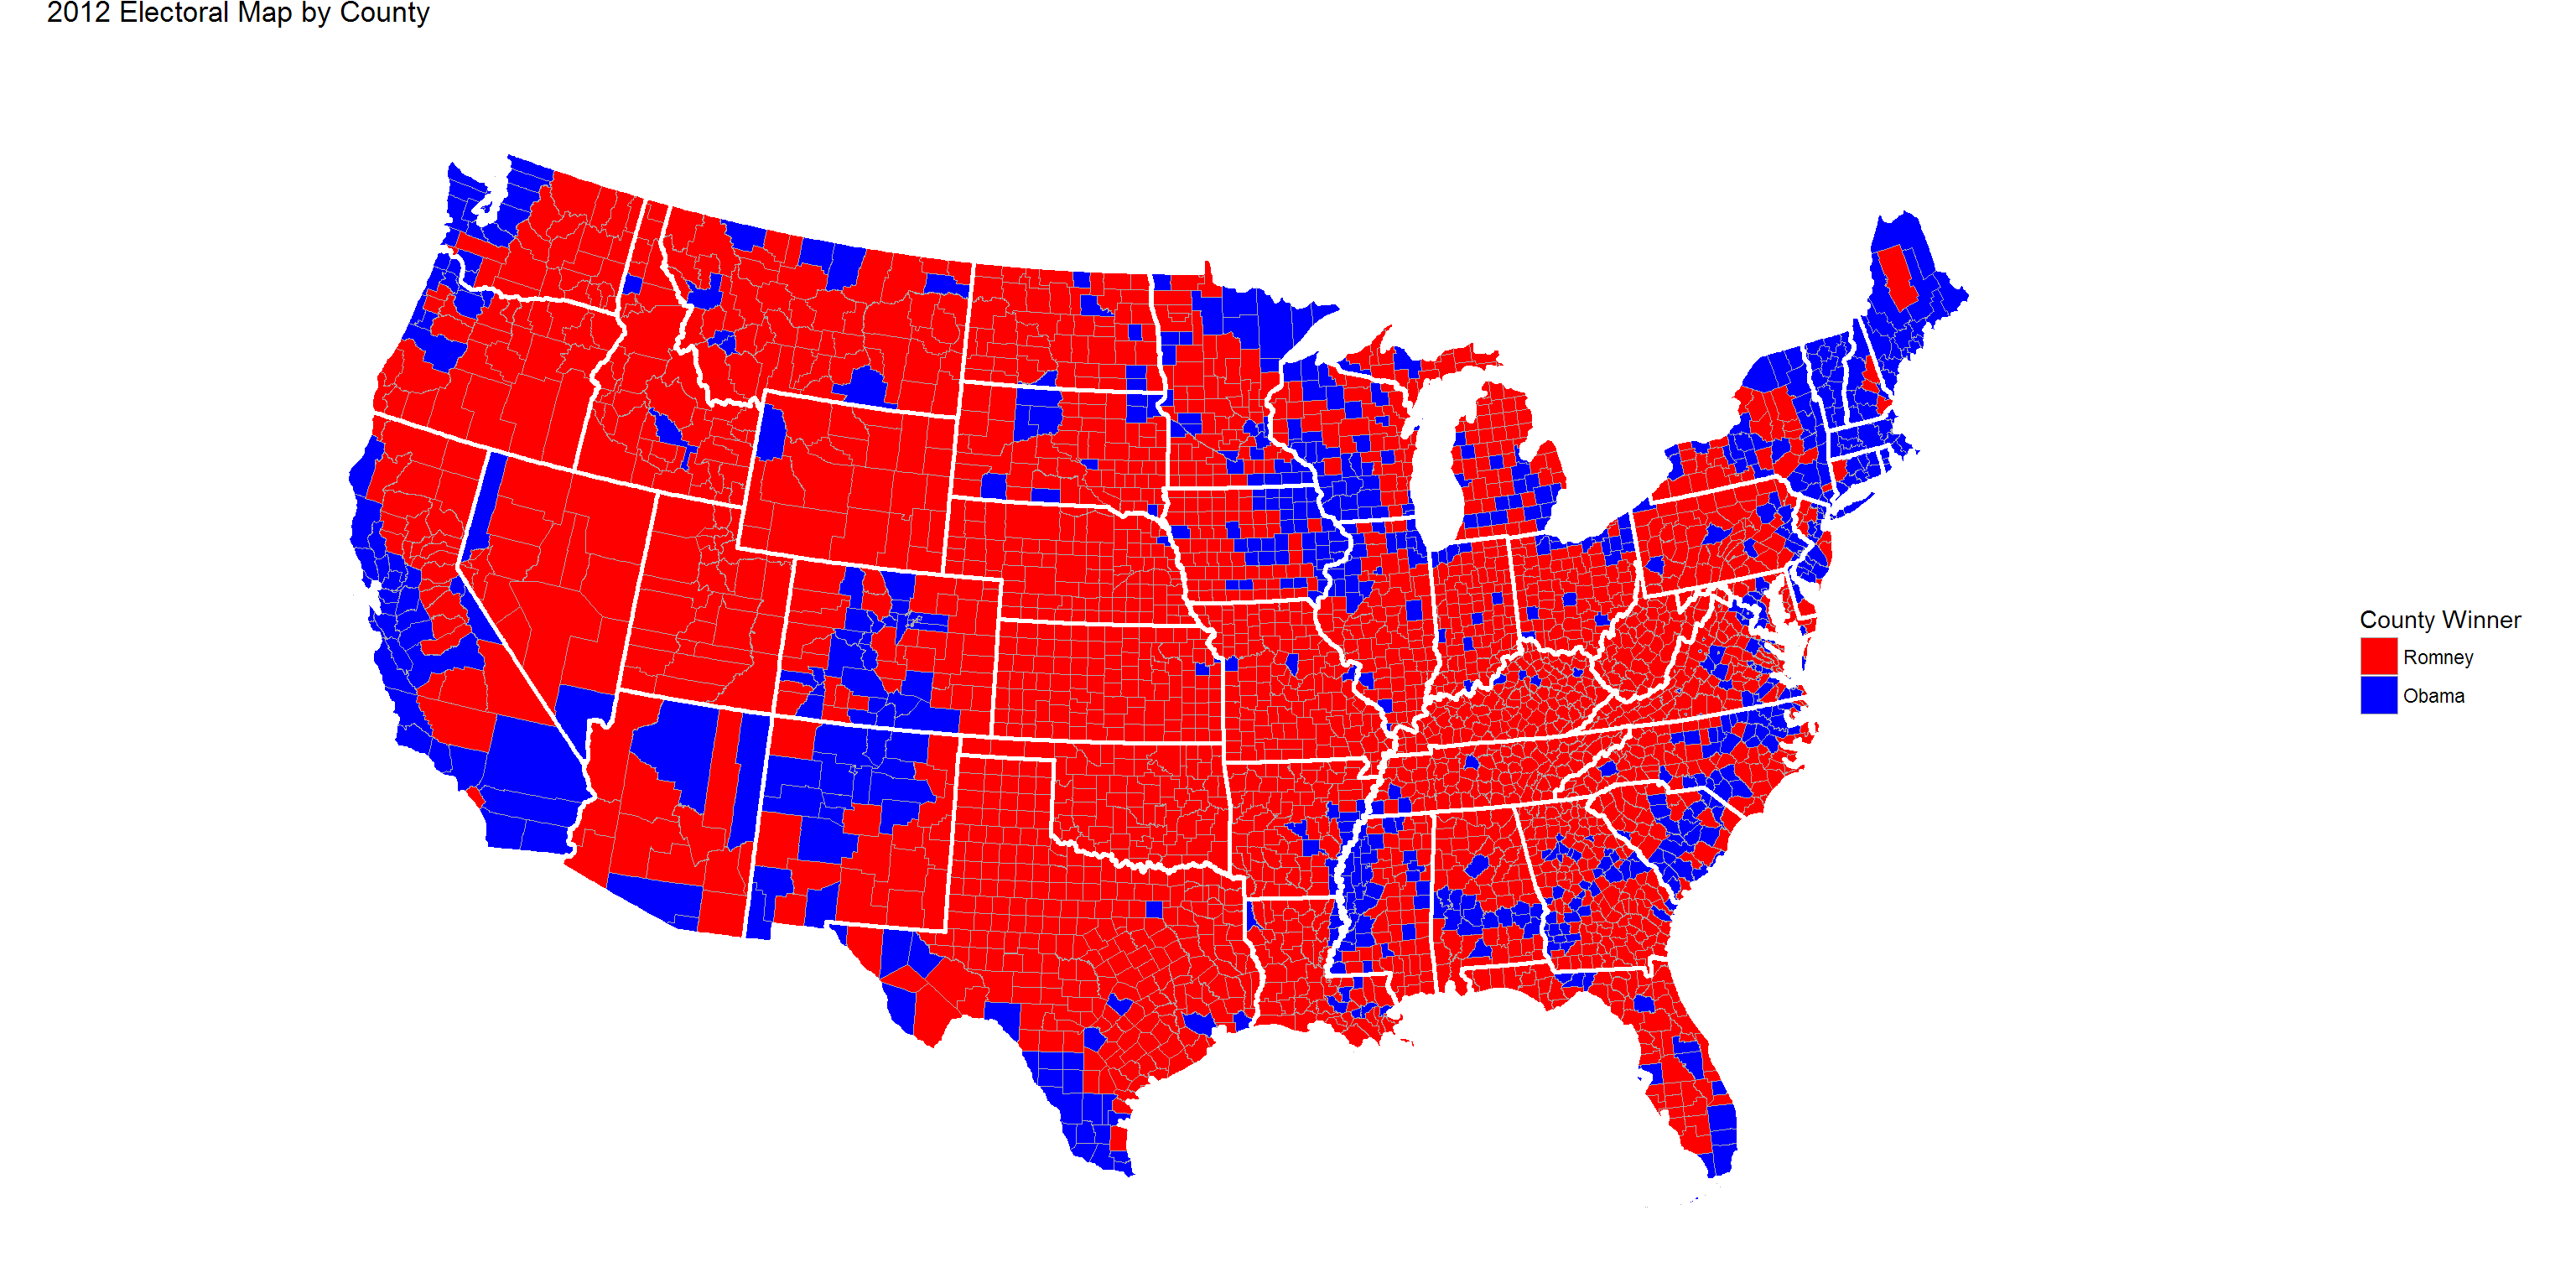
Let’s compare the win-loss maps by county from 2012 to 2016.
2012
2016
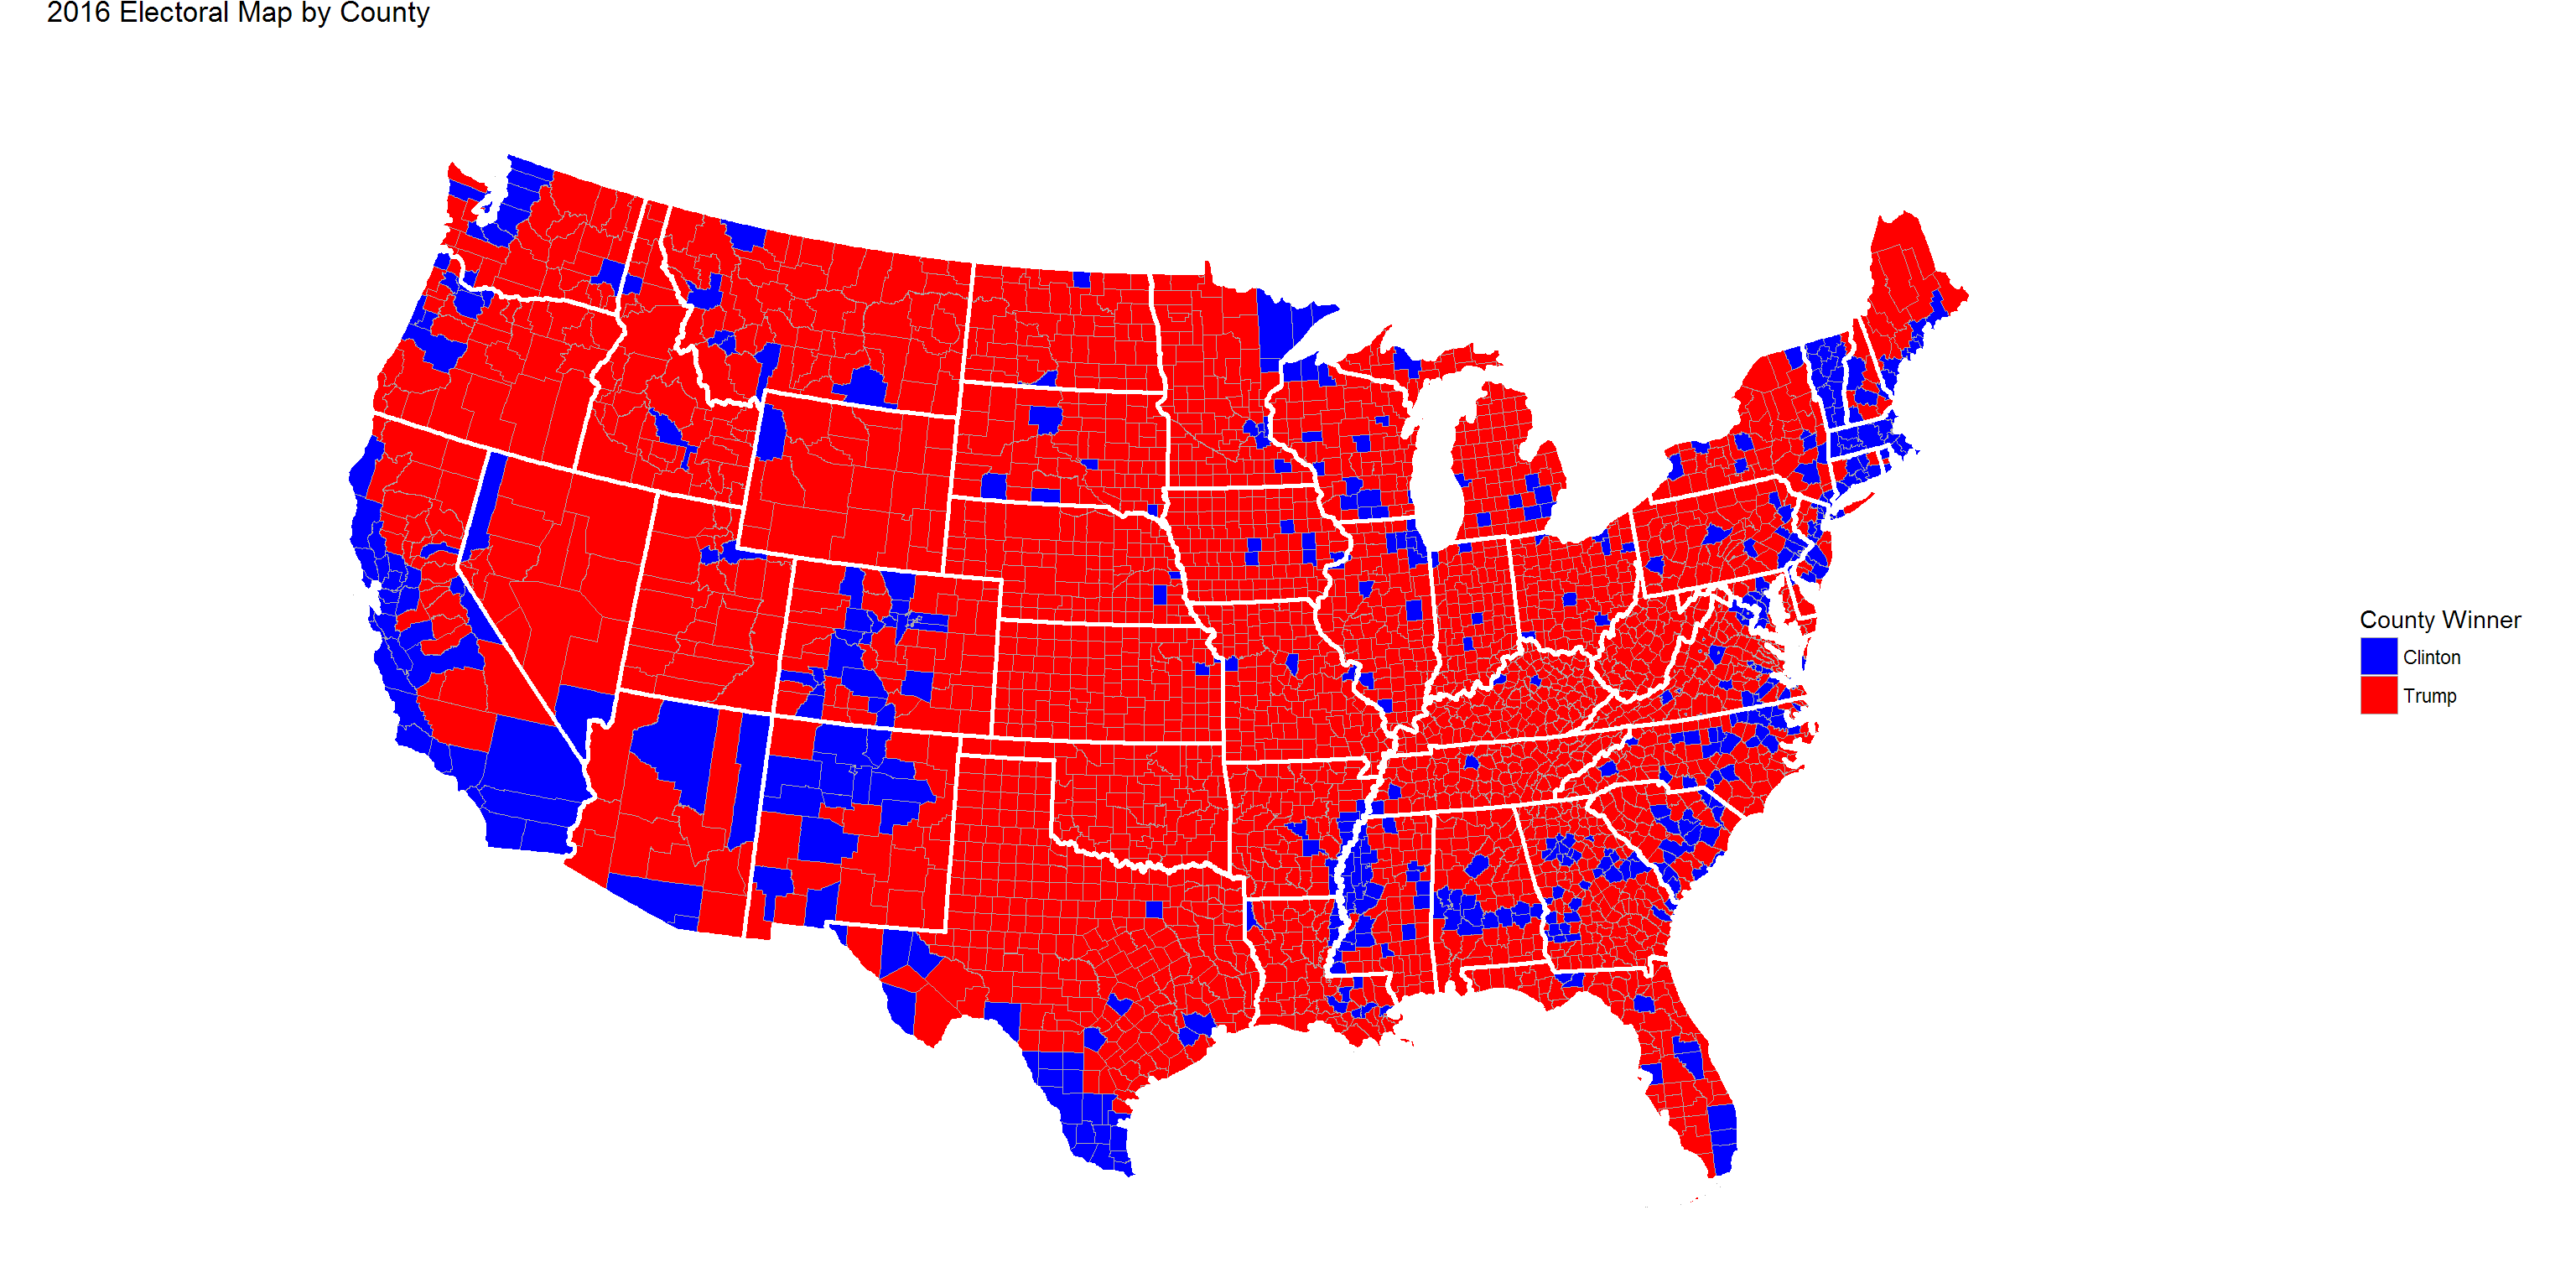 As evidenced in the maps, Obama was much more successful than Clinton in the Northeast and Midwest (note that these graphs do not account for turnout, so we’re only able to measure strict win-loss). We’ll explore these areas further in the maps below.
2016 Flipped Counties
How successful were each of the candidates in flipping counties from their previous victor? Below is a graph of the 2016 electoral map, with flips highlighted in yellow for Trump (Trump winning a county won by Obama in 2012) and green for Clinton (Clinton winning a county won by Romney in 2012).
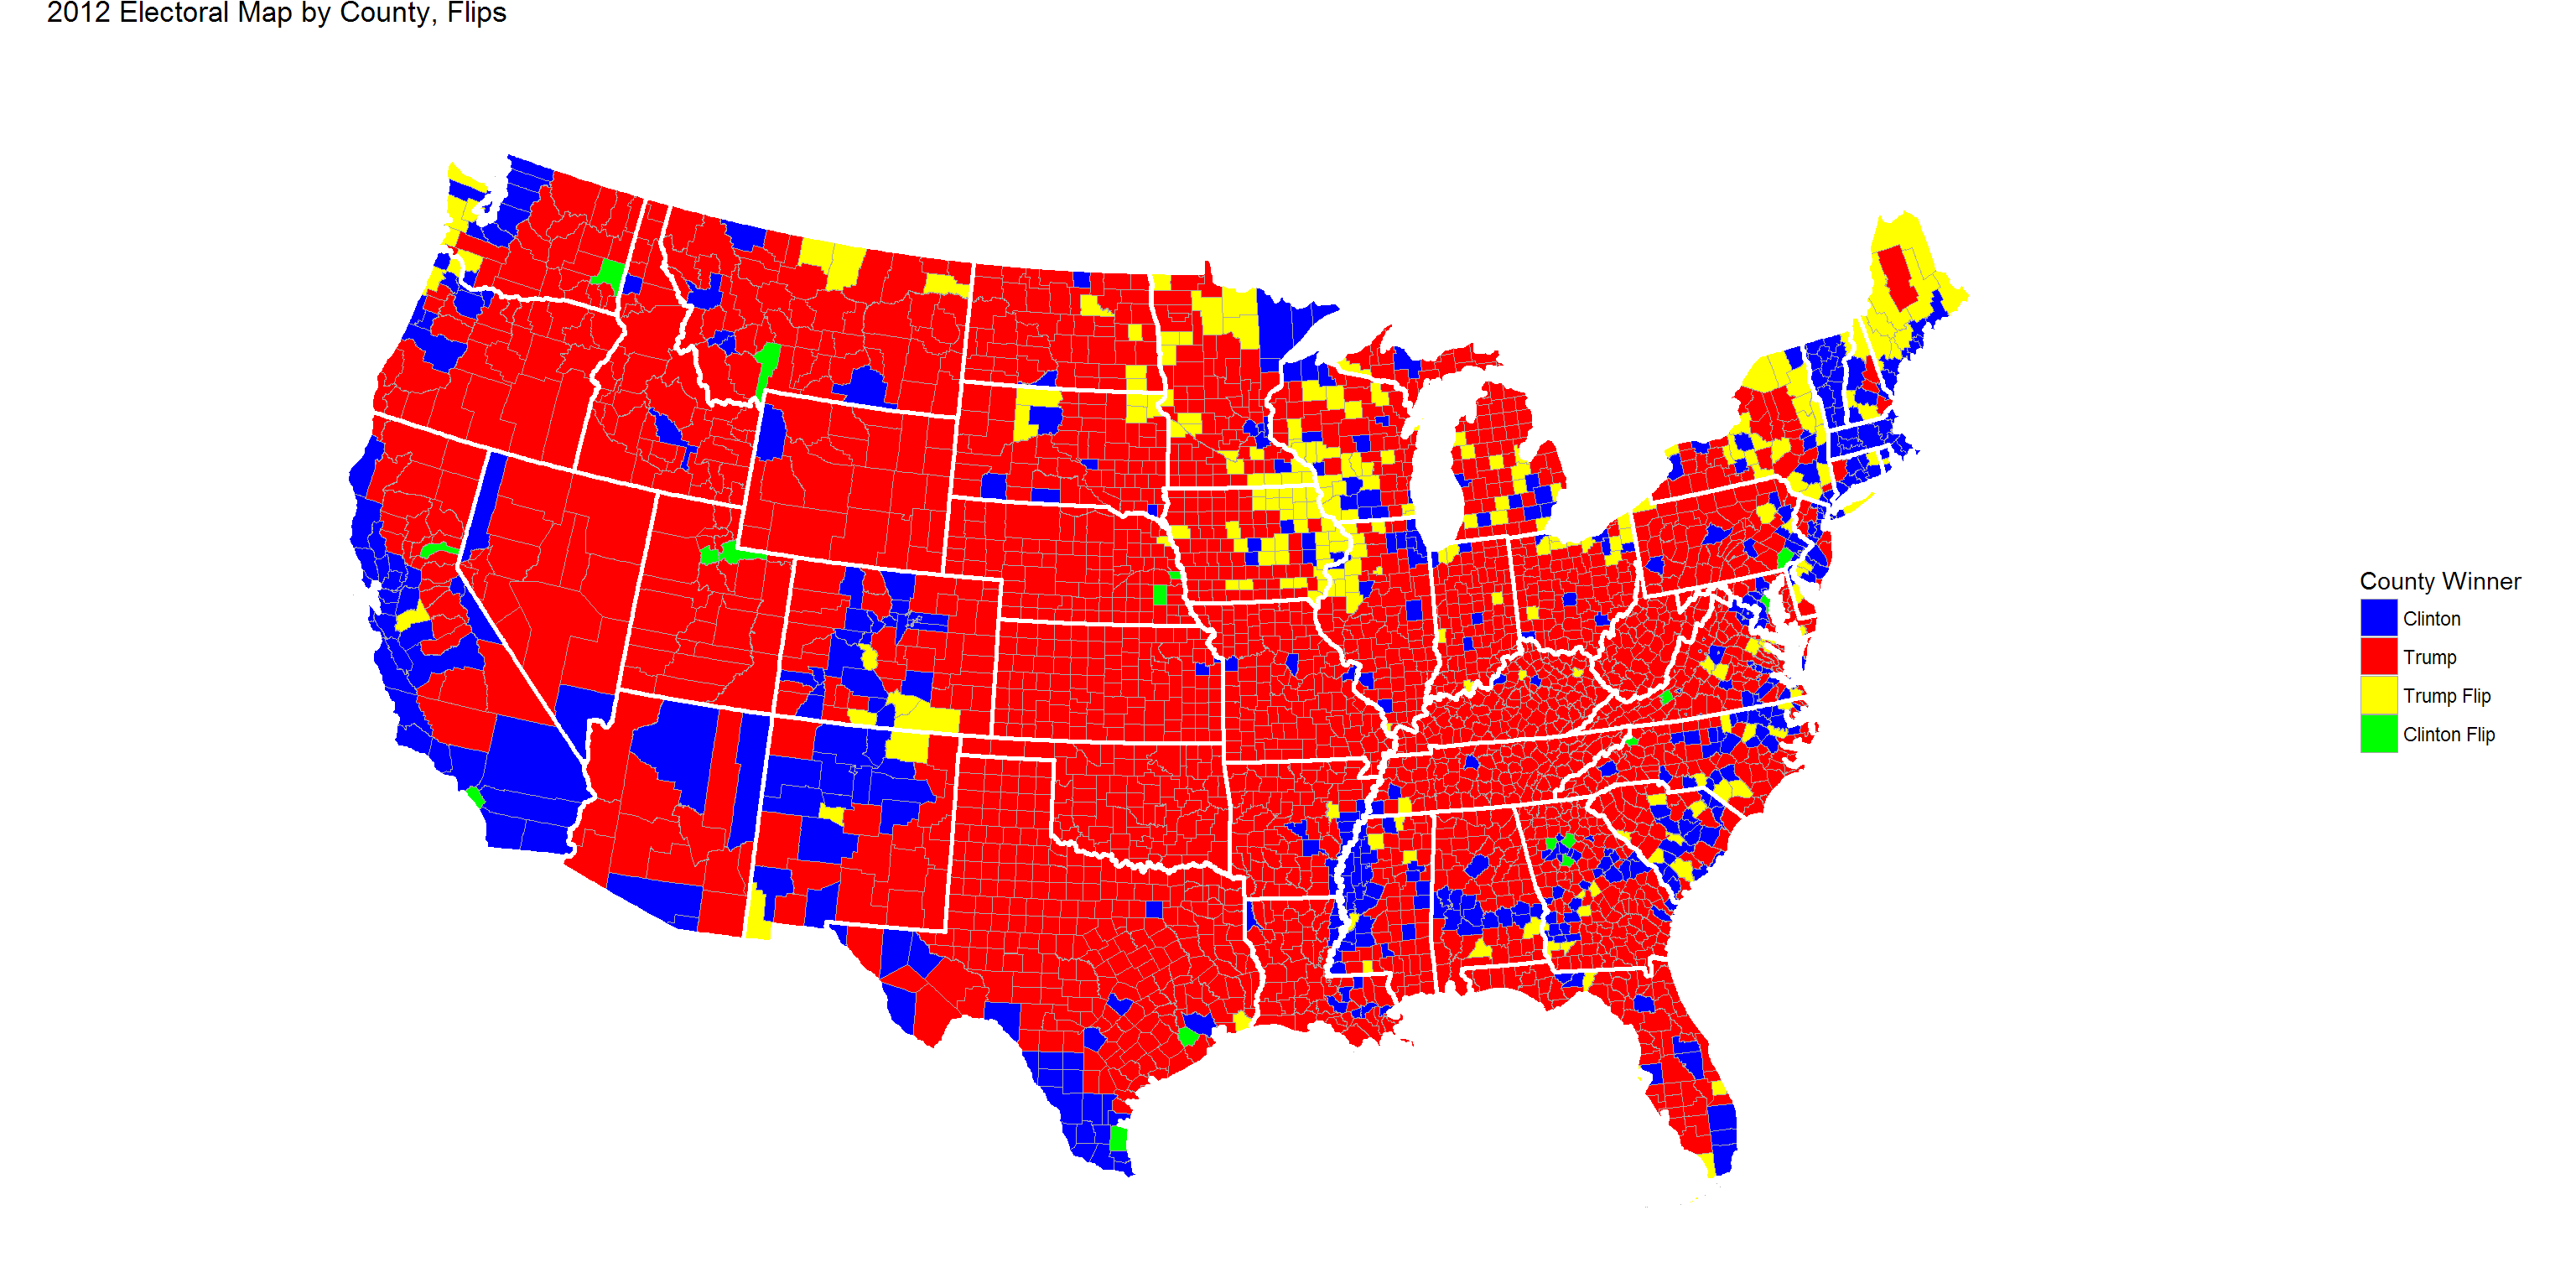
We can clean up the colors by marking the unchanged counties in grey and re-marking the flipped counties for clarity. 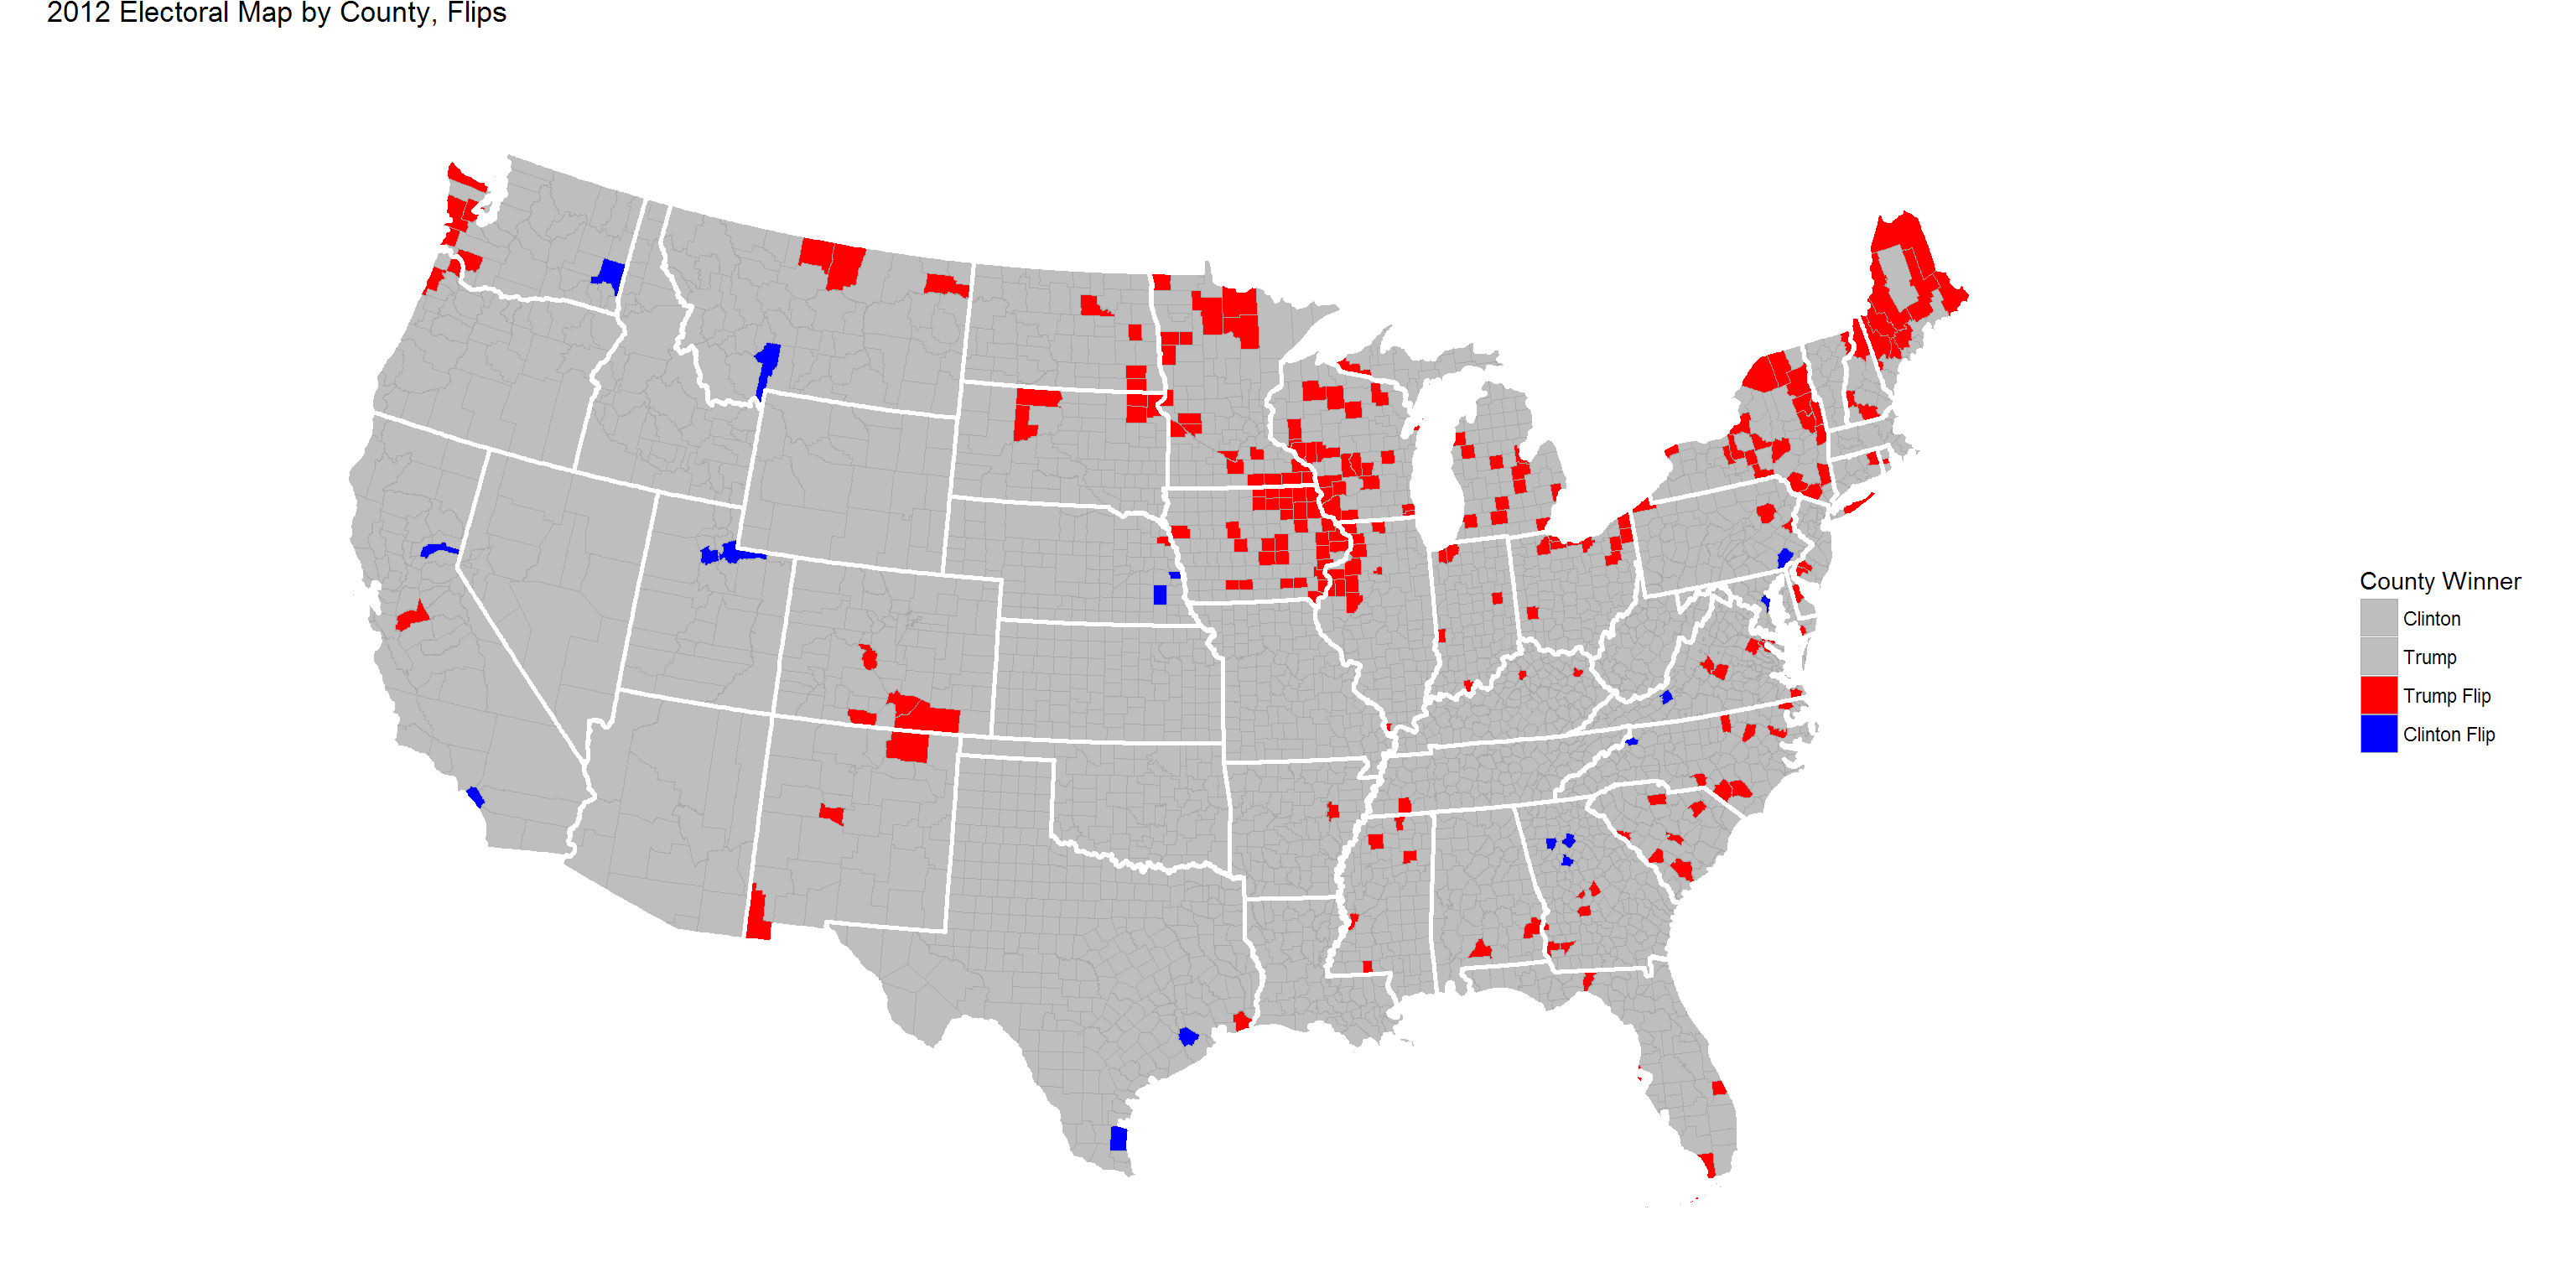
Table of Flipped Counties by State
We can further drill down and take a look at the geographic breakdown of flipped counties by state.
Trump
Clinton
As evidenced from the tables above, Trump was much more successful than Clinton in flipping counties from 2012 to 2016, flipping 223 counties won by Obama in 2012 compared to Clinton’s 17 counties won by Romney in 2012.
Interactive
Given the information from above, it looks as if Clinton lost significant numbers of counties in the Northeast and Midwest that were once held by Obama. Let’s explore in greater detail
Northeast
Midwest
Voter Turnout Comparisons
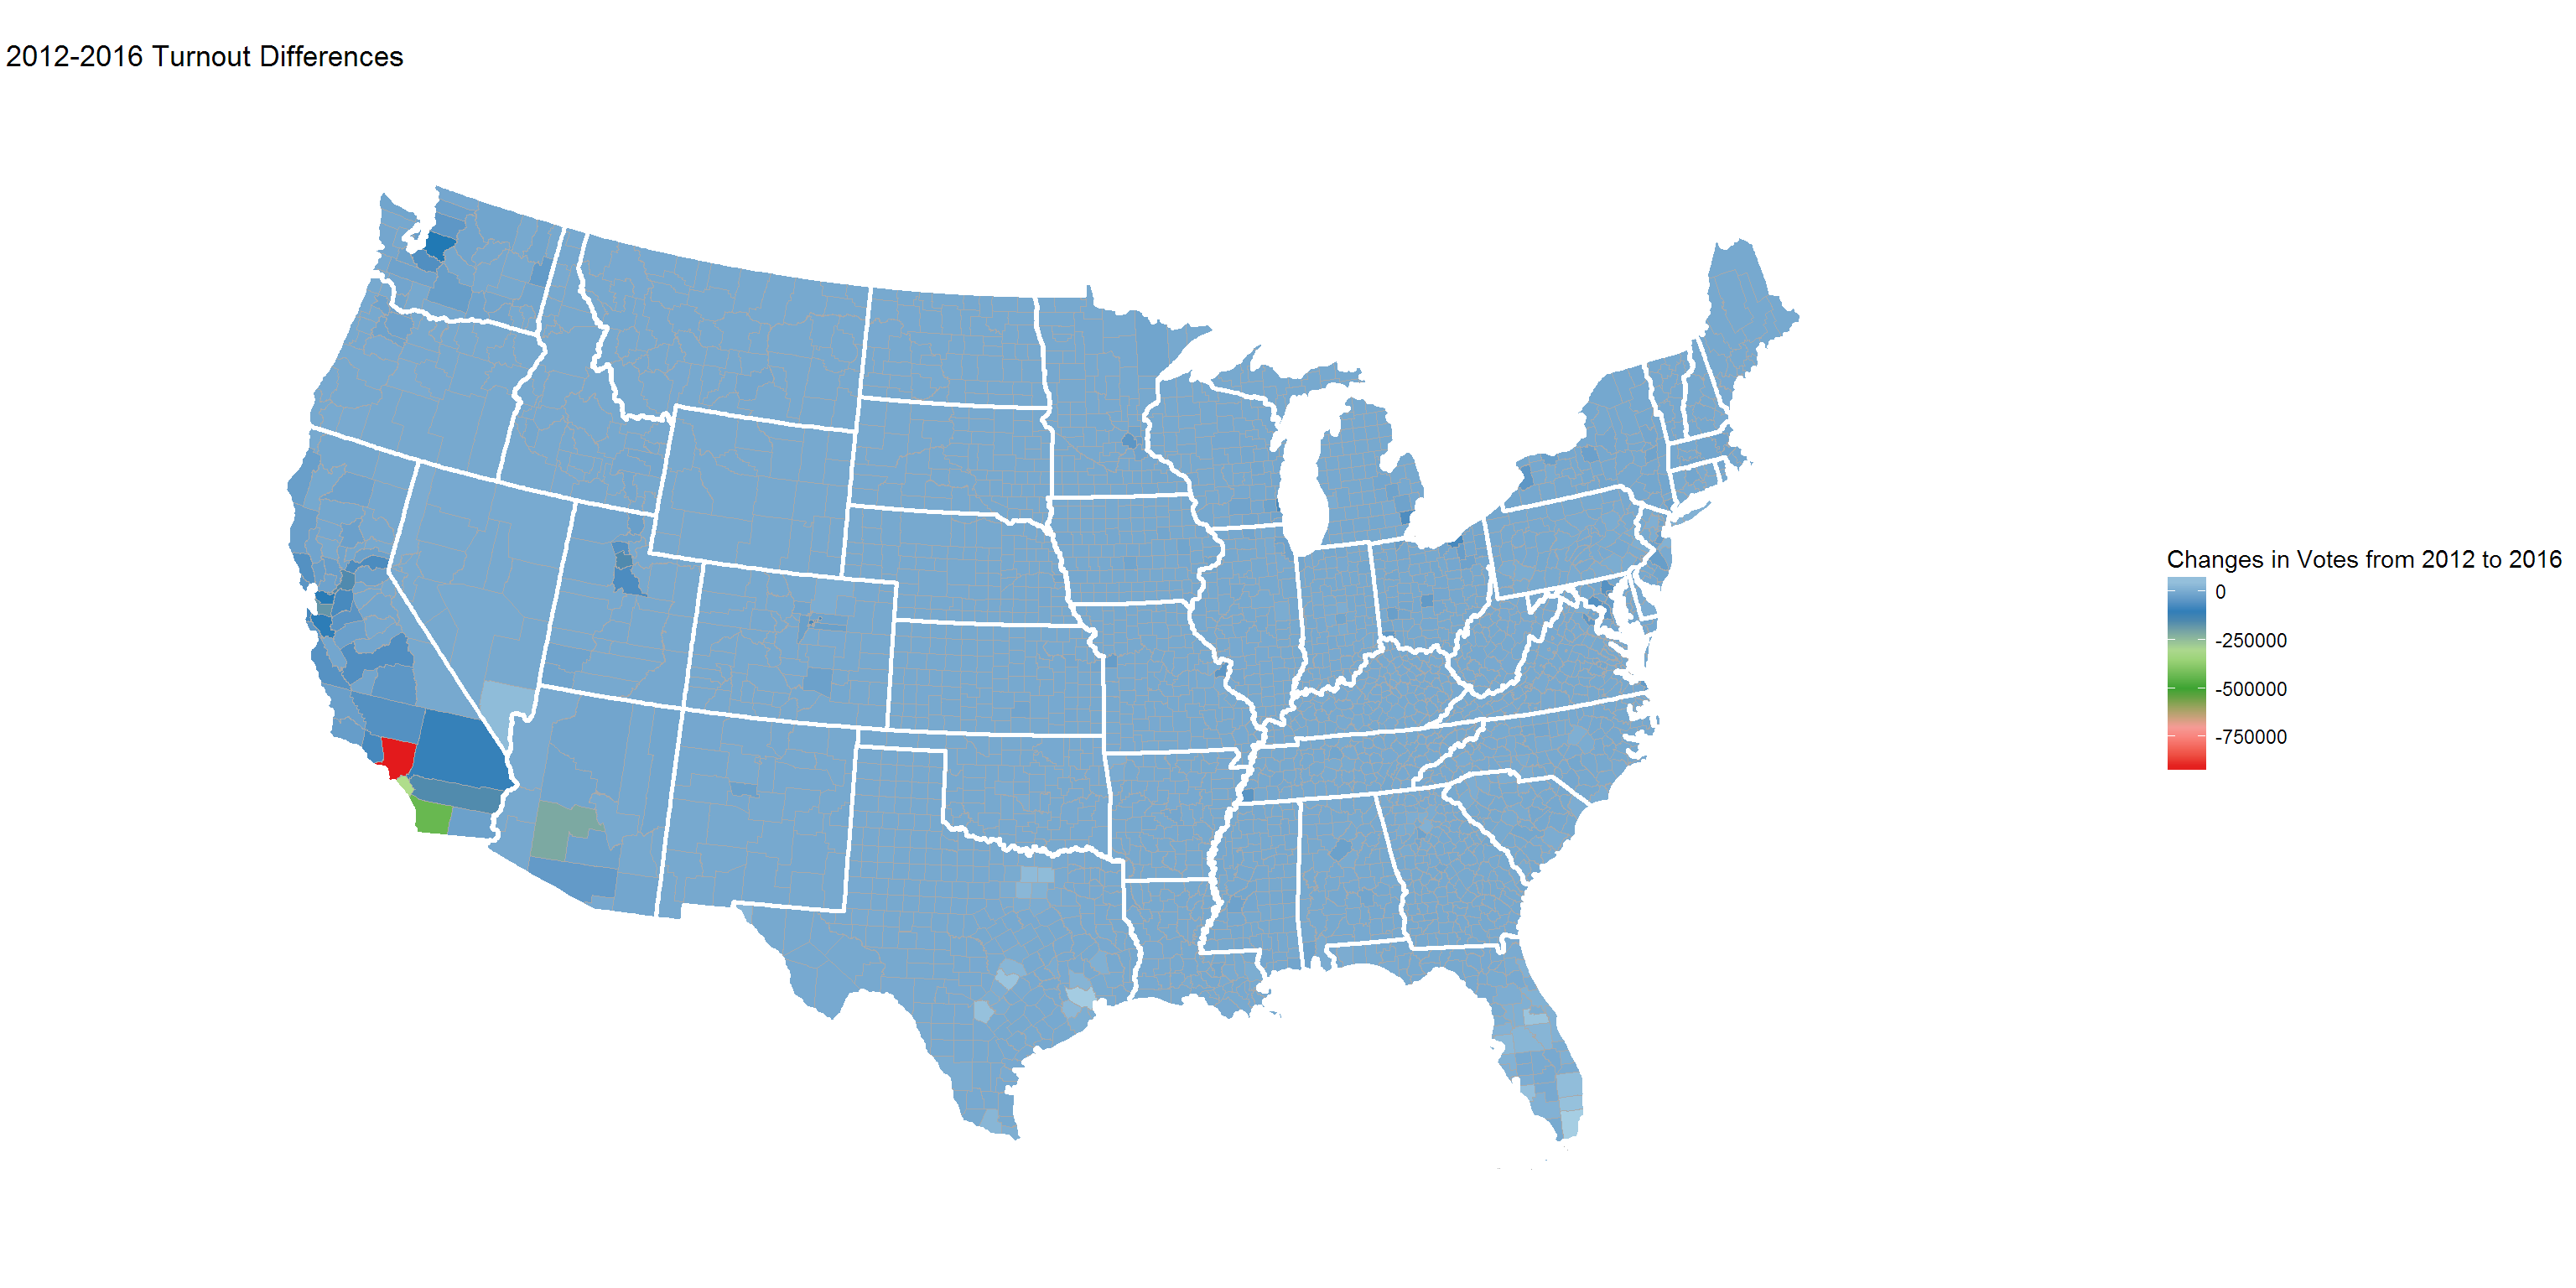
Given the voting information for 2012 and 2016, we can also construct a representation of voter turnout from 2012 to 2016. As a side note, the very large decrease was from Los Angeles County for both parties.
2012-2016, Total Turnout
2012-2016, Republican Party Turnout
We can compare the 2012 and 2016 turnouts for just the Republican Party. Note the interesting pockets of lower-than-expected turnout in Arizona, Utah, and Washington.

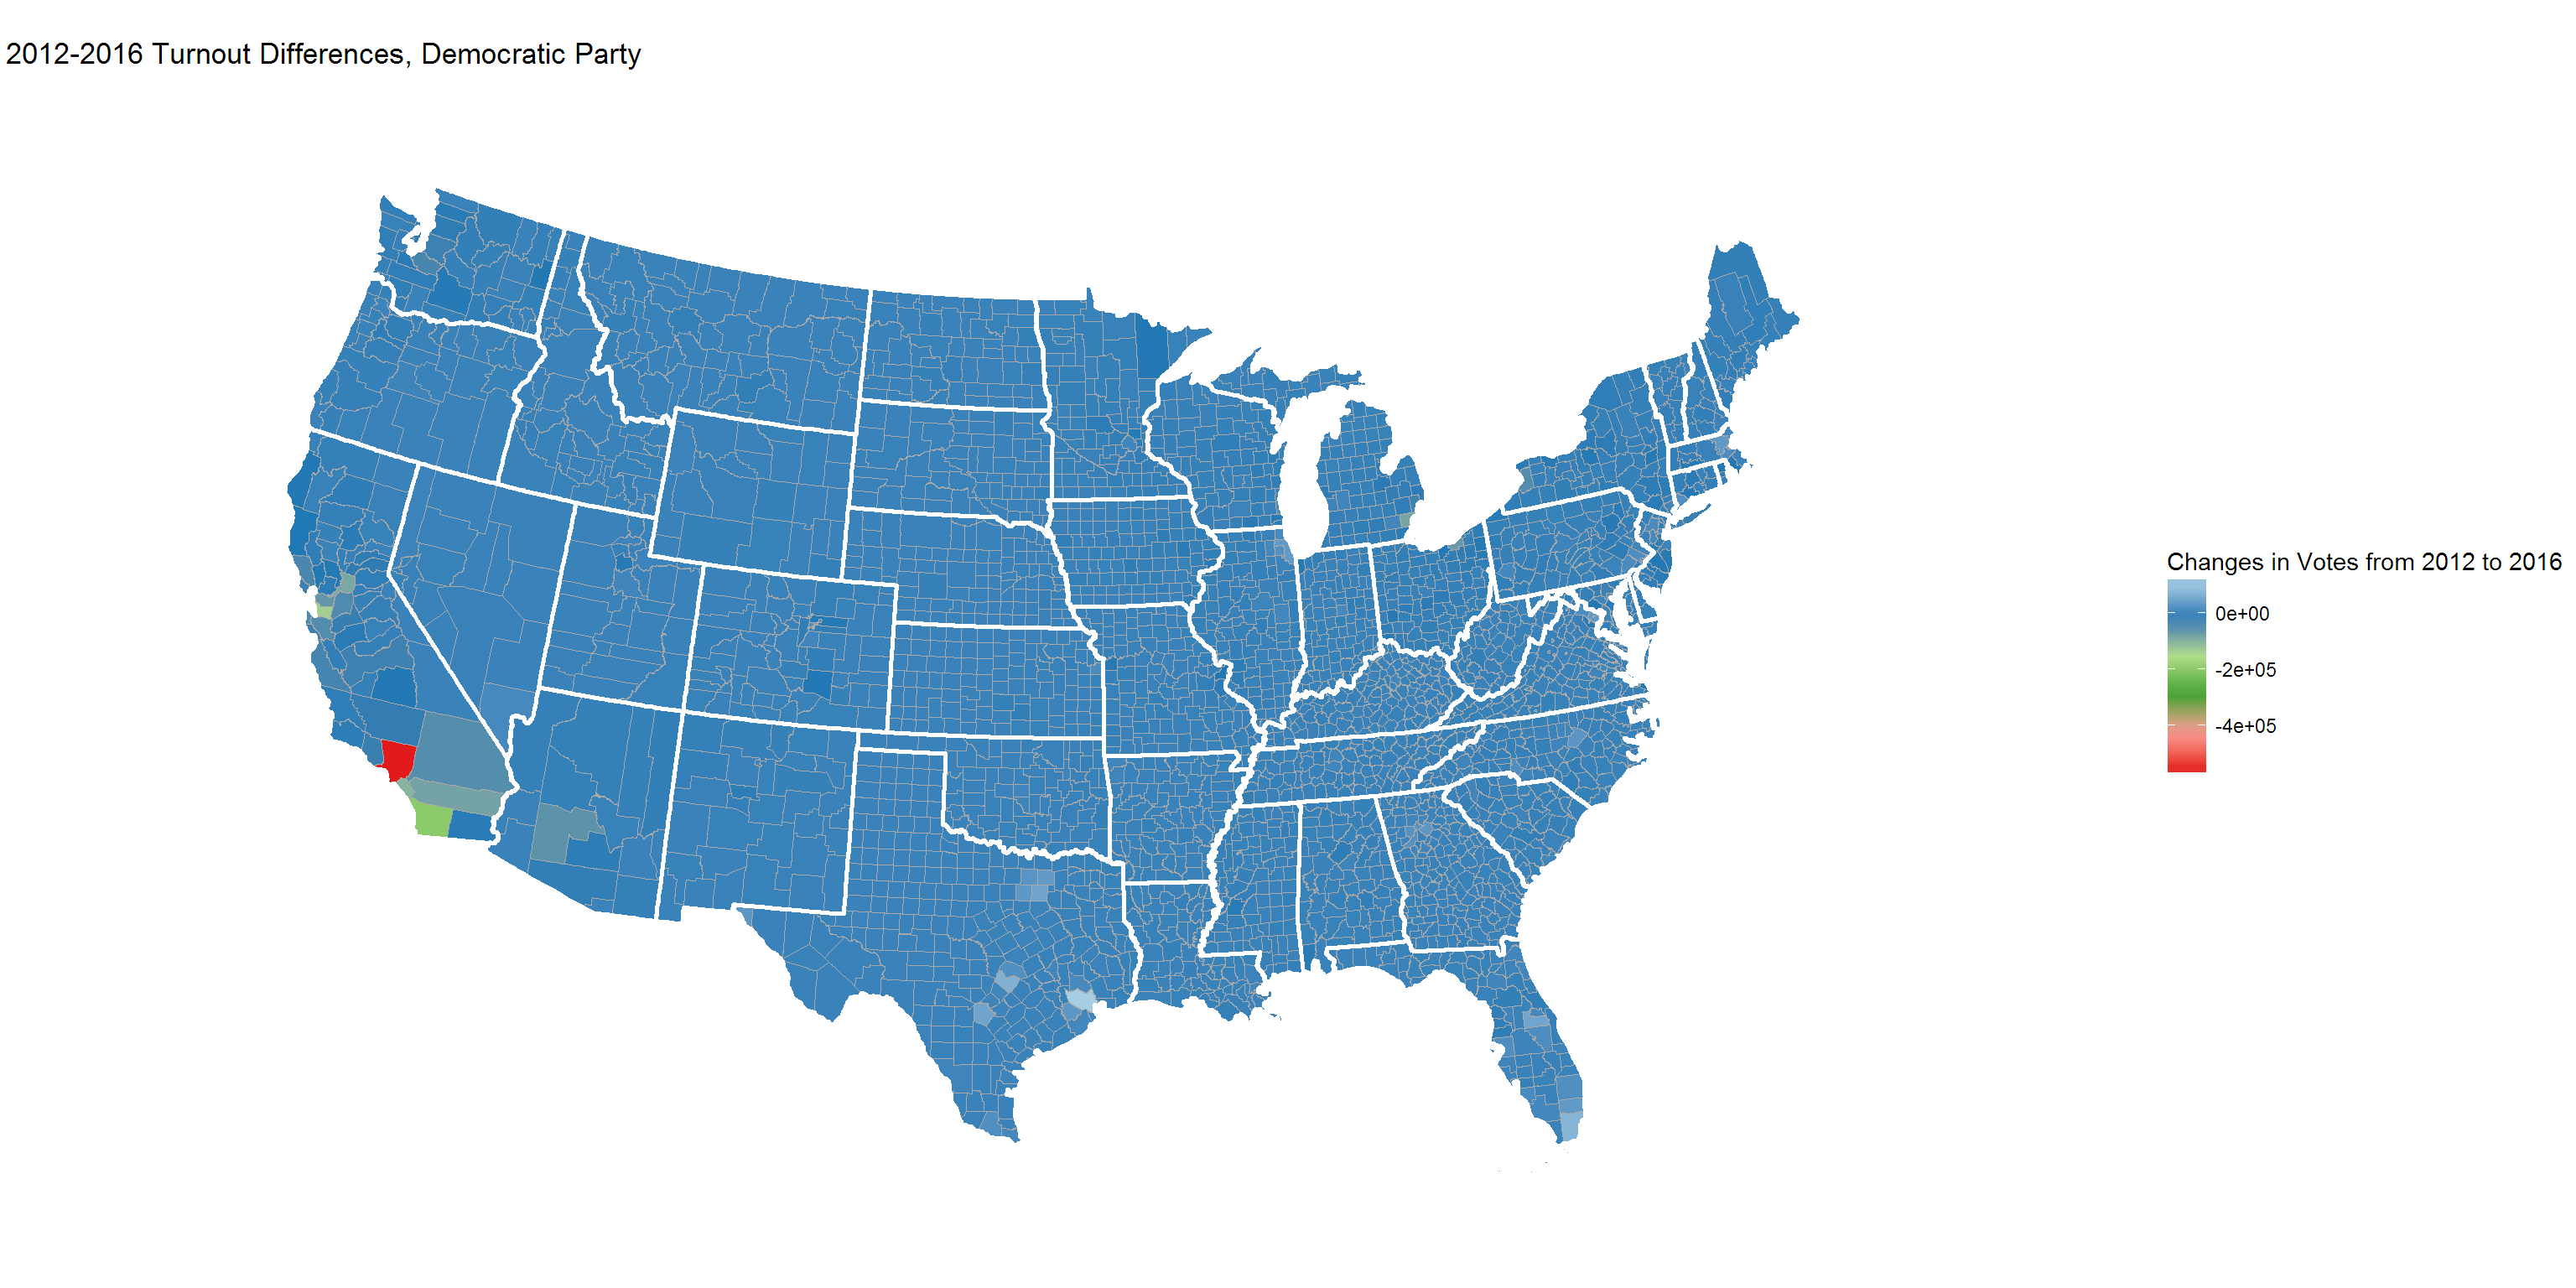
2012-2016, Democratic Party Turnout
We can do the same for the Democratic Party (the gradient is fixed for the Democratic and Repuiblican turnout graphs to facilitate comparison). Note that the disparity in LA County is much more pronounced for the Democrats than the Republicans.